Build the business case for preventing mobile plant incidents

Use the SonaSafe ROI calculator to estimate the potential cost of forklift and mobile plant incidents, including downtime, claims, operational disruption and the value of reducing high-risk interactions before they become LTIs.
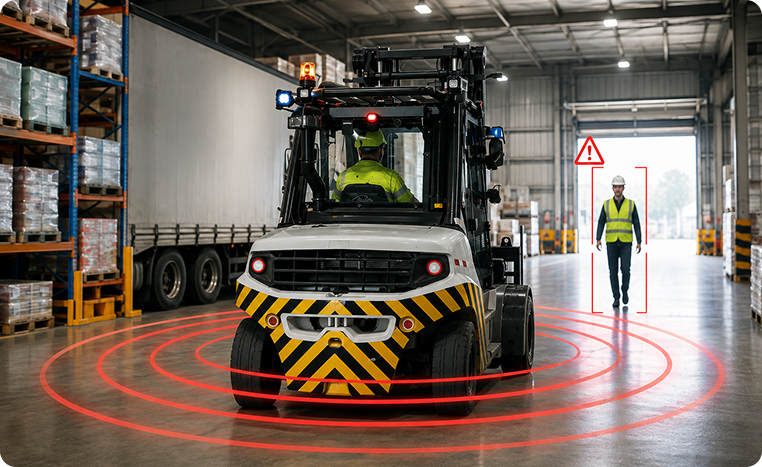
What the calculator helps you consider

Incident frequency and near-miss history.

Direct and indirect incident costs.

Operational disruption, investigations and retraining.

Insurance and compliance pressure.

Potential benefit of reducing repeated high-risk interactions.

The value of a pilot before scale commitment.

Estimate your cost of inaction

Cost of Inaction Calculator

What is your cost of inaction on mobile-plant safety?

Build an evidence-based business case in under two minutes. Every figure is drawn from Safe Work Australia and recognised safety sources — adjust any assumption to match your site.

1

Your site

2

Cost of a serious incident

An itemised, transparent build-up — no hidden multiplier. Defaults are industry averages; override any line, and add a note on your own figures.

Incident cluster — Bird 1969 pyramid i

Used as an exposure-modelling framework, it estimates the typical base of lesser events beneath serious incidents across a population of sites, applying a law of averages. This is not a prediction that this exact site will produce these exact counts. Applying Bird's 1:10:30 ratio, this model helps determine a full exposure cost.

Minor injuries — 10 × per serious (Bird) Minor lost-time claim (<1 week), true employer cost — SWA indirect-cost ratio
Property-damage events — 30 × per serious (Bird) Your estimate — no published benchmark; rack/product/plant damage
3

Annual indirect exposure

Recurring annual cost carried whether or not a single incident occurs — lowered morale, absenteeism, turnover, reputational and insurance drag attributable to mobile-plant risk. Added directly to your annual exposure. Enter your own figure.
Enforcement & fines exposure i
The 0.5% default above is a general estimate based on WorkSafe Victoria's 2023–24 Annual Report. 178 completed OHS prosecutions across 35,575 workplace visits that year (178 ÷ 35,575 ≈ 0.5%). This is not mobile-plant-specific and likely understates the true rate for a genuine notifiable incident involving mobile plant. Formula: average fine × major incidents/yr (the count used in the Bird cluster above) × your probability estimate = annual enforcement exposure.
4

Expected improvement

50%
30% (conservative) to 80% (high), 50% default (recommended 65% minimum). Real SonaSafe Year-1 results: 65% warning-zone breach reduction (Mainstream NZ), with the resulting increase in site situational awareness typically producing a higher improvement in near-misses.
7 yrs
5 (lower range) to 10 years (upper range), 7-year default — SonaSafe's mean system lifetime value. A safety system is a multi-year capital asset, not a one-year cost.
5

Value Drivers

Beyond avoided incident cost, a safety system returns value across several measurable drivers. Each is on by default at the industry average — toggle off, or adjust the value and weight, to match your own view.

1. Insurance premium savings i
20%
Industry average: premiums are experience-rated (EMR). Enter your own premium — no industry average exists for the dollar figure, only the credit rate. Contribution = premium × weight.
2. Worker retention & safety culture i
50%
Default value = one avoided turnover/year. Weight is a judgement estimate of how much is attributable to visible safety culture.
3. Regulatory risk reduction i
50%
Covers legal defence, audit burden, enforceable undertakings and compliance uplift. Enter your own site-specific estimate.
4. Your own value drivers (optional — counted automatically when entered)

Add factors specific to your operation — contract eligibility, brand exposure, insurer mandates.

Estimated annual cost of inaction
$ 0
The conservative yearly exposure from mobile-plant incidents at your site, before any control is applied.
$0
Avoidable per year with SonaSafe i
0
Near-misses prevented / year i
0
Workers covered i
Total value over asset life i
$0
Return per $1 invested i
$2 – $6
External industry benchmark (OSHA / ASSP / Liberty Mutual) — not calculated from your inputs above.
Indicative payback i
In your proposal
True payback depends on your quoted price and real incident history — confirmed in a tailored SonaSafe proposal.
Break-even i
< 1 serious incident
Preventing this many incidents over the asset life covers the system.
Experience-rating saving i
Up to ~20% premium
Indicative. A lower claims record reduces experience-rated premiums (AU EMR / NZ ACC).
Enforcement & fines exposure i
$0/yr
Toggle on in Annual Indirect Exposure to include.

Over the system's life i

Cost of inaction (7-yr) $0
Avoidable with SonaSafe (7-yr) $0

Get your branded business case

We'll email a SonaSafe PDF report with every figure, assumption and source explained — ready to share with your board.